Value of Call Options for Microsoft and Google
Jun 28
Options are a device that allows an investor to hedge potential losses for a cost. A call option gives the purchaser the right, but not the obligation, to buy a stock at a given price. A put option gives the purchaser the right, but not the obligation, to sell a stock at a given price. The counter party to the agreement has the obligation to either sell or buy (call and put) at the agreed price if the option is exercised.
The exercise date is always in the future, and the further an option is in the future, the more it will cost. How much more depends on the exercise price, interest rates and the volatility of the stock. To give you an idea, here’s some data from Microsoft and Google showing the call option prices going four months into the future. I obtained this data from Yahoo! Finance for Microsoft and Google.
To make monthly analysis more relevant, I’ve included only the call options that have been traded for a given strike price in each of the four months analyzed. I also collapsed recent trade prices for options with the same strike price in some cases.
Call Option Pricing
Microsoft
The stock price at the time these options values were captured was $34.54.
| July, 2013 | August, 2013 | September, 2013 | October, 2013 | ||
|---|---|---|---|---|---|
| Strike | Last | Last | Last | Last | stdev (annual) |
| $29.00 | $5.69 | $4.50 | $5.35 | $5.77 | 1.743 |
| $30.00 | $4.81 | $4.75 | $4.80 | $4.85 | 0.123 |
| $31.00 | $3.66 | $3.85 | $3.80 | $4.09 | 0.537 |
| $32.00 | $2.77 | $2.88 | $2.97 | $3.22 | 0.575 |
| $33.00 | $1.88 | $2.20 | $2.32 | $2.55 | 0.837 |
| $34.00 | $0.77 | $1.41 | $1.66 | $1.85 | 1.413 |
| $35.00 | $0.16 | $0.86 | $1.13 | $1.33 | 1.533 |
| $36.00 | $0.25 | $0.50 | $0.70 | $0.99 | 0.939 |
| $37.00 | $0.09 | $0.24 | $0.43 | $0.63 | 0.702 |
| $38.00 | $0.03 | $0.12 | $0.28 | $0.43 | 0.530 |
| $39.00 | $0.01 | $0.03 | $0.15 | $0.27 | 0.361 |
| $40.00 | $0.02 | $0.04 | $0.08 | $0.16 | 0.186 |
| $41.00 | $0.01 | $0.02 | $0.05 | $0.11 | 0.135 |
The stock price at the time these options values were captured was $880.37.
| July, 2013 | August, 2013 | September, 2013 | October, 2013 | ||
|---|---|---|---|---|---|
| Strike | Last | Last | Last | Last | stdev (annual) |
| $700.00 | $180.87 | $179.00 | $216.00 | $186.00 | 51.831 |
| $750.00 | $135.10 | $144.67 | $127.40 | $151.80 | 32.104 |
| $770.00 | $103.50 | $113.90 | $104.20 | $126.00 | 31.591 |
| $780.00 | $102.73 | $105.50 | $122.00 | $108.20 | 25.675 |
| $800.00 | $73.12 | $87.90 | $91.80 | $94.40 | 28.519 |
| $805.00 | $81.22 | $81.20 | $114.04 | $91.52 | 46.438 |
| $810.00 | $69.64 | $74.90 | $80.90 | $109.00 | 52.622 |
| $820.00 | $59.15 | $71.77 | $91.20 | $94.50 | 50.059 |
| $825.00 | $58.00 | $59.00 | $96.80 | $74.90 | 54.452 |
| $830.00 | $52.00 | $56.80 | $65.00 | $80.90 | 38.027 |
| $835.00 | $49.60 | $54.10 | $87.60 | $83.40 | 58.769 |
| $840.00 | $45.90 | $56.63 | $61.00 | $71.01 | 31.222 |
| $845.00 | $41.16 | $53.10 | $81.10 | $60.53 | 50.314 |
| $850.00 | $39.80 | $42.50 | $58.00 | $64.70 | 36.089 |
| $860.00 | $29.94 | $43.37 | $46.50 | $52.90 | 29.026 |
| $865.00 | $33.60 | $40.80 | $48.90 | $49.55 | 22.632 |
| $870.00 | $30.28 | $37.00 | $41.90 | $47.40 | 21.835 |
| $875.00 | $28.80 | $34.70 | $39.60 | $48.10 | 24.491 |
| $880.00 | $27.90 | $32.44 | $37.10 | $45.90 | 23.069 |
| $885.00 | $24.20 | $29.30 | $36.20 | $43.50 | 25.175 |
| $890.00 | $18.00 | $24.00 | $34.00 | $41.20 | 30.959 |
| $895.00 | $19.60 | $25.40 | $26.30 | $46.80 | 35.680 |
| $900.00 | $18.00 | $22.05 | $29.20 | $35.60 | 23.355 |
| $905.00 | $17.93 | $20.00 | $26.20 | $32.20 | 19.357 |
| $910.00 | $16.16 | $16.50 | $25.80 | $33.70 | 25.181 |
| $915.00 | $12.70 | $16.45 | $23.20 | $28.50 | 21.086 |
| $920.00 | $11.12 | $16.39 | $22.55 | $27.60 | 21.549 |
| $925.00 | $9.10 | $12.90 | $19.70 | $29.00 | 26.193 |
| $930.00 | $8.80 | $11.20 | $19.40 | $31.80 | 31.135 |
| $935.00 | $7.38 | $10.90 | $13.60 | $22.20 | 18.967 |
| $940.00 | $6.41 | $11.19 | $16.80 | $23.20 | 21.726 |
| $945.00 | $5.40 | $8.70 | $15.50 | $21.60 | 21.654 |
| $950.00 | $5.10 | $7.20 | $14.10 | $19.40 | 19.643 |
| $955.00 | $4.00 | $7.80 | $14.20 | $16.40 | 17.146 |
| $960.00 | $6.50 | $5.61 | $10.10 | $21.90 | 22.511 |
| $965.00 | $5.80 | $5.00 | $17.80 | $21.50 | 25.113 |
| $970.00 | $2.85 | $4.90 | $8.30 | $16.90 | 18.591 |
| $975.00 | $1.60 | $4.20 | $7.50 | $12.70 | 14.360 |
| $980.00 | $1.93 | $4.40 | $12.07 | $11.80 | 15.492 |
| $985.00 | $1.25 | $6.30 | $6.10 | $12.20 | 13.444 |
| $990.00 | $1.99 | $4.10 | $10.70 | $10.00 | 12.942 |
| $995.00 | $0.85 | $6.80 | $7.40 | $10.20 | 11.795 |
| $1,000.00 | $2.25 | $2.80 | $4.20 | $8.40 | 8.347 |
| $1,010.00 | $0.80 | $4.90 | $6.30 | $7.50 | 8.751 |
| $1,020.00 | $0.35 | $1.15 | $6.20 | $7.10 | 10.325 |
| $1,030.00 | $0.25 | $3.10 | $2.51 | $7.20 | 8.690 |
| $1,040.00 | $0.20 | $0.97 | $1.90 | $4.80 | 6.037 |
| $1,050.00 | $0.15 | $0.58 | $1.55 | $4.30 | 5.593 |
| $1,060.00 | $0.29 | $0.55 | $3.50 | $3.70 | 5.523 |
| $1,070.00 | $0.10 | $0.60 | $2.25 | $2.85 | 3.929 |
| $1,080.00 | $0.15 | $0.35 | $2.60 | $2.75 | 4.211 |
| $1,100.00 | $0.30 | $0.40 | $0.60 | $2.00 | 2.380 |
Black-Scholes formula
The Black Scholes formula is a sophisticated statistical mechanism that can help project options prices. I can be written simply as
![Value of call option = [delta \times share price] - [bank loan]](https://s0.wp.com/latex.php?latex=Value+of+call+option+%3D+%5Bdelta+%5Ctimes+share+price%5D+-+%5Bbank+loan%5D&bg=ffffff&fg=000000&s=0 "Value of call option = [delta \times share price] - [bank loan]")
Where
")

 \times PV(EX)")
and,
![d_1 = \frac{log[\frac{P}{PV(EX)}]}{\sigma\sqrt{t}} + \frac{\sigma\sqrt{t}}{2}](https://s0.wp.com/latex.php?latex=d_1+%3D+%5Cfrac%7Blog%5B%5Cfrac%7BP%7D%7BPV%28EX%29%7D%5D%7D%7B%5Csigma%5Csqrt%7Bt%7D%7D+%2B+%5Cfrac%7B%5Csigma%5Csqrt%7Bt%7D%7D%7B2%7D&bg=ffffff&fg=000000&s=0 "d_1 = \frac{log[\frac{P}{PV(EX)}]}{\sigma\sqrt{t}} + \frac{\sigma\sqrt{t}}{2}")

N(d) is the cumulative normal probability density function, EX the exercise price, t the number of periods to exercise date, P the price of stock today and 
Black-Scholes values
The authors of the textbook have provided some Excel based resources to help explore these devices. For standard deviation I’ll use the values above for the strike price nearest the stock price at the time I captured the data. In this case it was 34.54 and 880.37 for Microsoft and Google Respectively. That same valuation will be used for the standard deviation. Due to the super low interest rates right now, I’ll use an interest rate of 1%.
Microsoft calculated call option price
The expected call value option for Microsoft is $0.16. The low value is due in part to the low standard deviation (low volatility). Here you can see how the calculations shaped up:
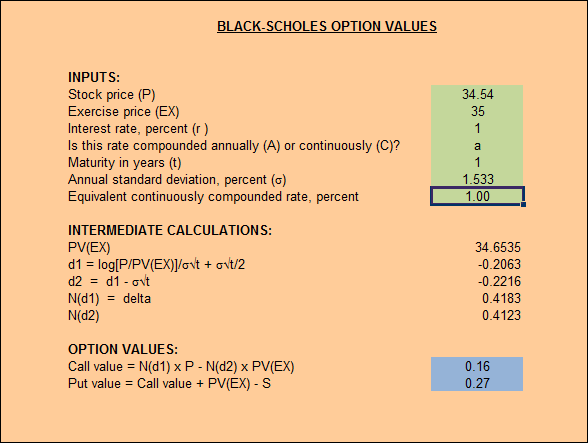
As you can see in the table of data above, the current call options for Microsoft range between $0.16 and $1.33. The Black-Scholes formula was accurate. However, it’s difficult to say whether the Black-Scholes formula predicted a phenomenon that would have been naturally ocurring, or if everyone trading options today uses a Black-Scholes calculator to determine what to pay for a call option.
Google calculated call option price
Google’s call option price reflects the higher standard deviation with a value of $85.05. Here are the details of that calculation:
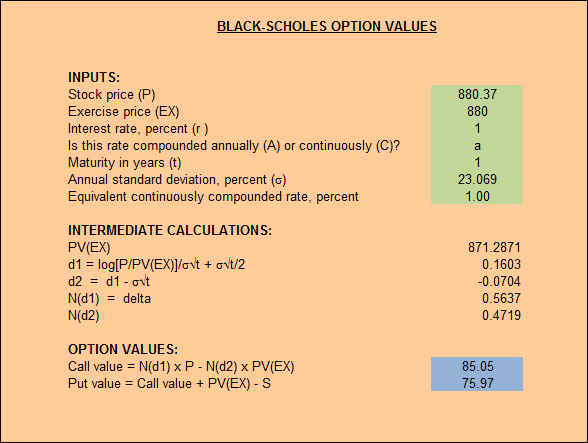
In this case the calculated call option value of $85.05 is much higher than the currently trading $24-$46 dollars. When I look further out there are some options trading at about a year and a half go as high as $66.10. It may seem that the calculated volatility doesn’t line up with the market’s current perception for Google.
Perceived Volatility
It’s pretty obvious that the higher volatility for Google doesn’t reflect the market’s perception of volatility. In fact, rather than 23.069, a standard deviation of between 9 and 12 would produce a value more true to the currently trading prices than what is shown above.
This may also suggest that there is more risk, but that the market is choosing, for whatever reason, to look past it.
Resources
In the analysis of this data I created a python script to take a few months of call options data and derive the unique set of data shown above. I also use this Excel spreadsheet to sort and calculate the standard deviation.
 I'm Daniel Watrous, welcome to my website.